Feature
Reporting & BIComing soon
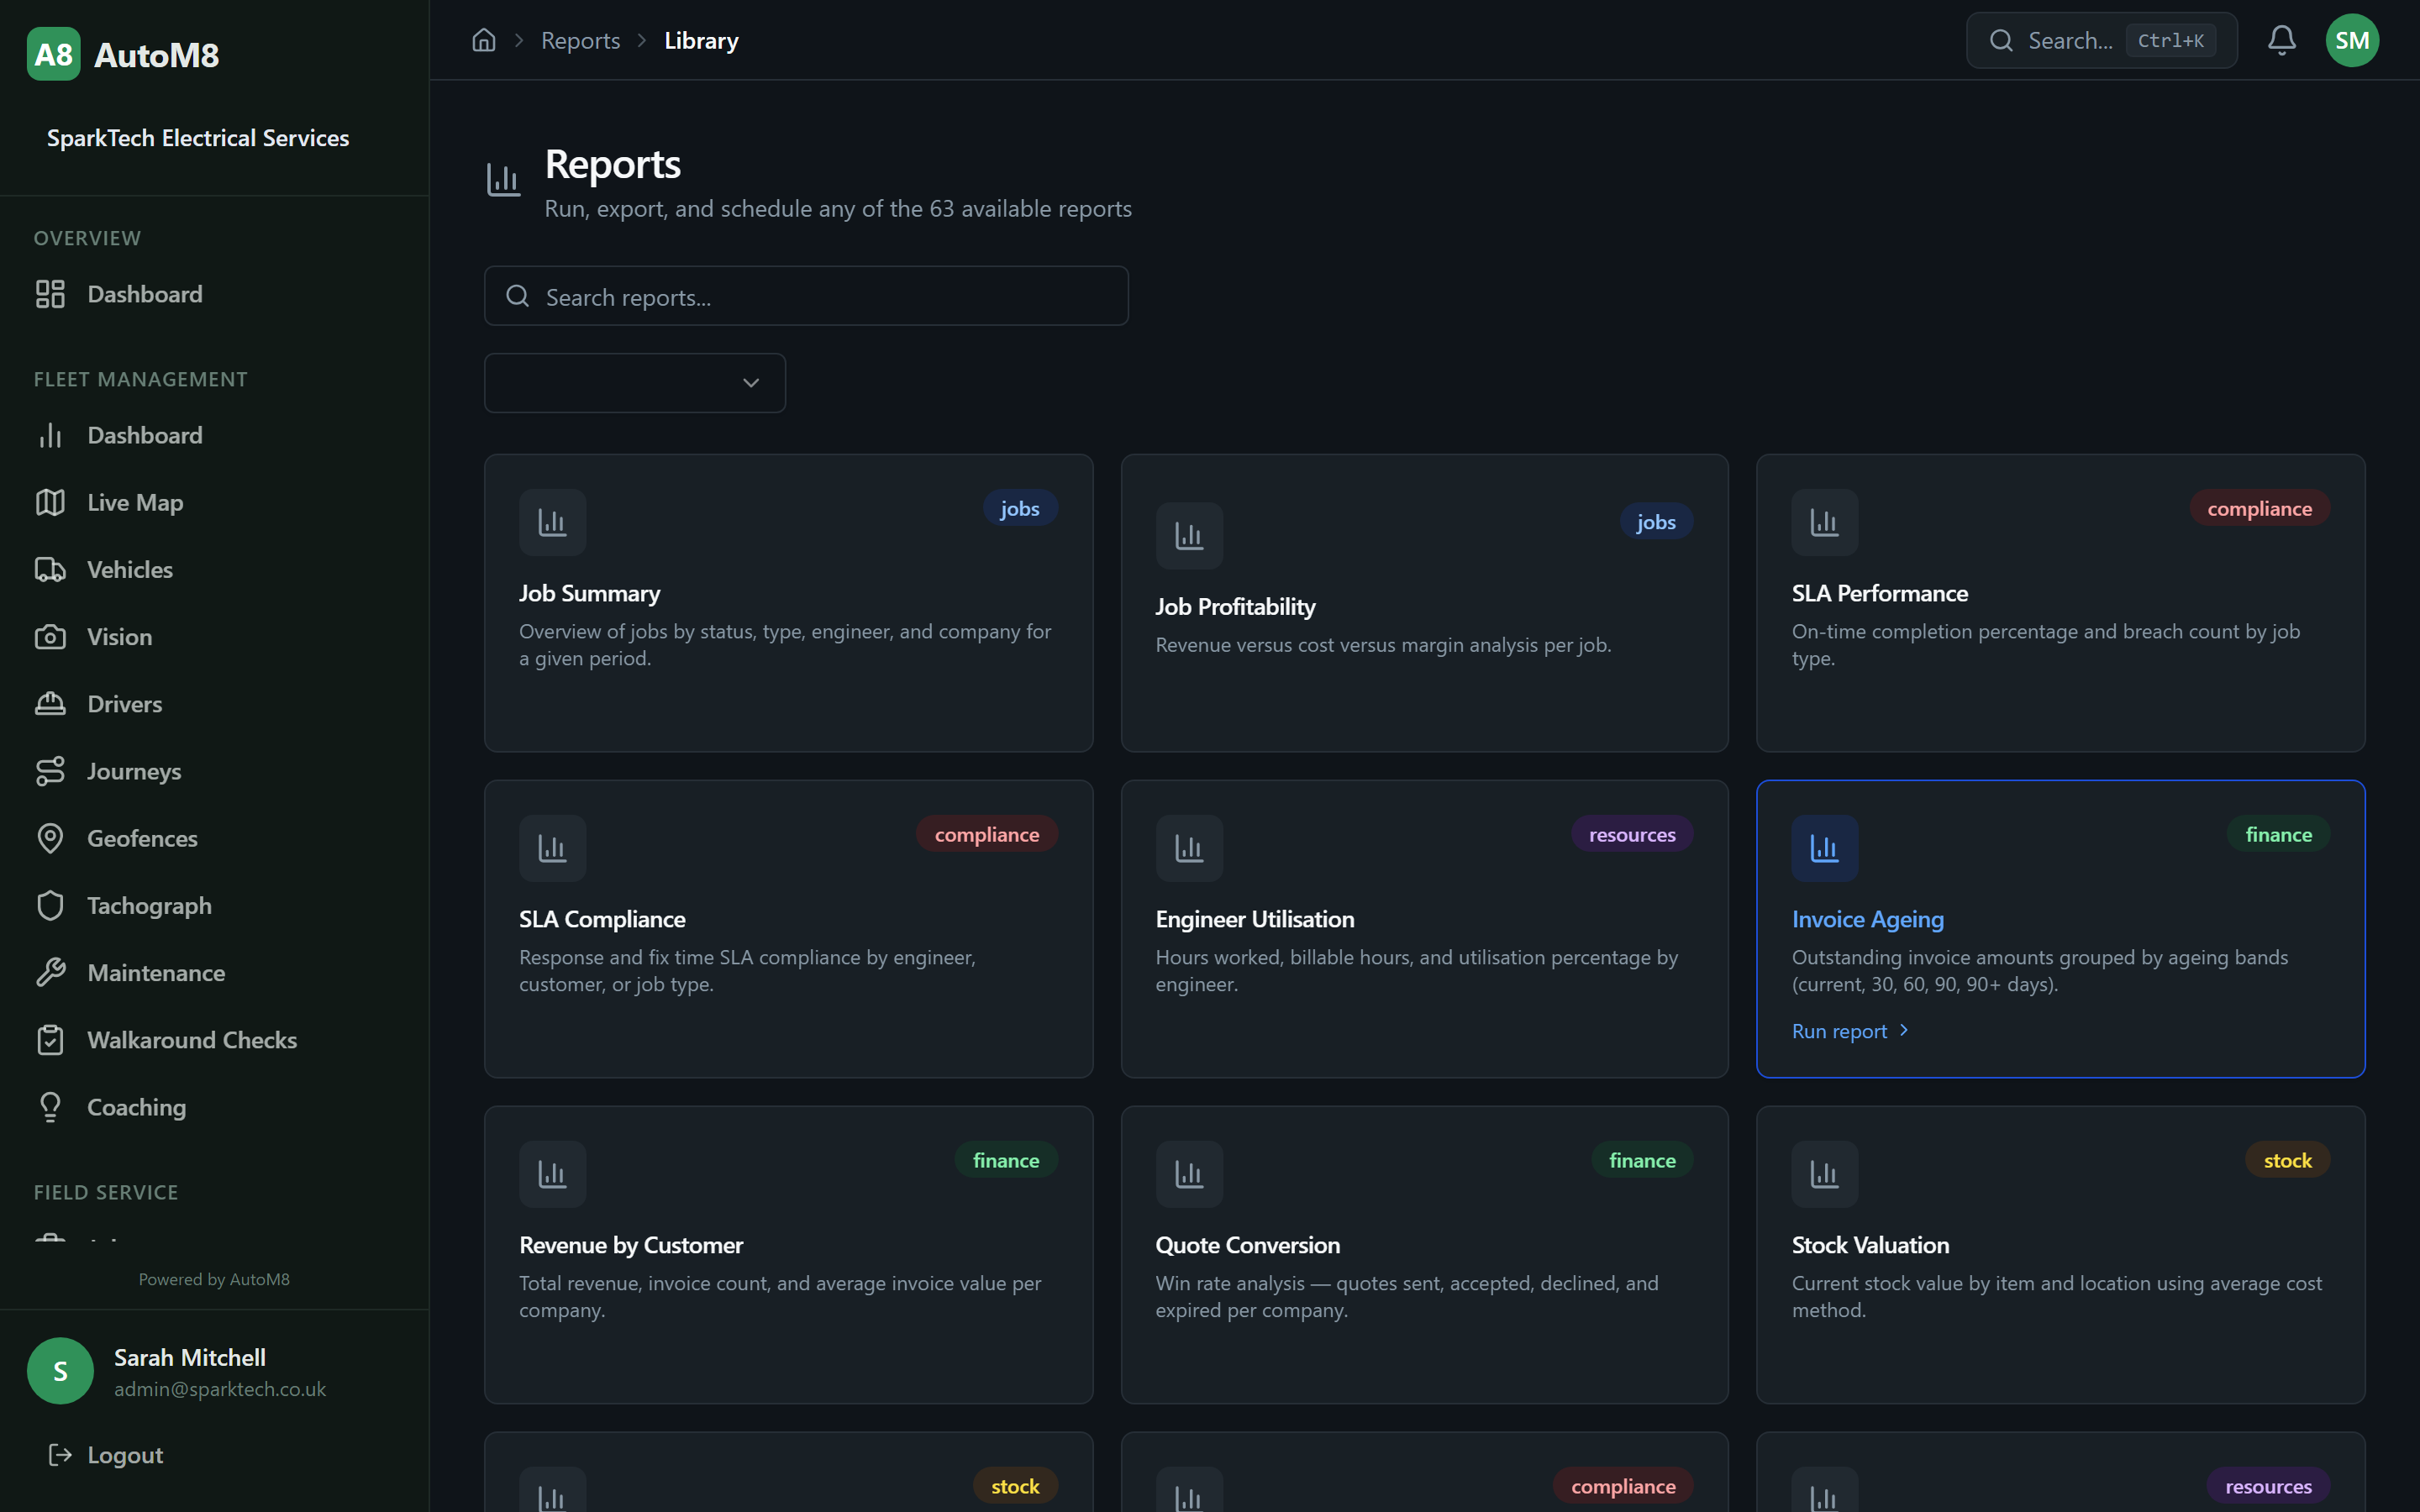
Dashboards draw on the same live data as the rest of the system, across jobs, fleet and finance. Exports read from that data too, so the screen and the spreadsheet agree.
What it does
Read how the operation is doing without exporting to a spreadsheet first.
Build the views you use and save them as presets.
Produce the figures the board asks for on demand.
Spot a trend while it can still be changed.
A scenario to try
The board pack is due on Thursday
Ask for this view in a demo. In place of a morning of exports that are stale by lunchtime, you open a saved preset for jobs completed, fleet activity and invoicing, and export it in the format the board uses.
A scheduled report email can send the same view each week without anyone asking. When one figure moves the wrong way for three weeks running, the trend is on the dashboard before it reaches a complaint.
How it works
- Dashboards show the live operational picture across jobs, fleet and finance.
- Report presets save the cuts of data you use often.
- Anything can be exported when you need it elsewhere.
- Reports run on the same live data as everything else, so the numbers agree.
DashboardsSaved presetsExport
Who it suits
Owners and managers who report to a board, a parent company or a client, and currently assemble the figures by hand. A single van owner may not need it.
Coming soon
Not live yet. Reporting belongs to the Complete plan, which has not launched.
Worth asking in a demo
- Which reports come ready-made as presets
- How dashboard layouts are arranged
- Which export formats and scheduled emails are offered
Related features
- Financial & Invoicing - Supplies job profitability for the finance figures.
- Maintenance - Supplies cost and downtime per vehicle.
- Fleet Tracking - Live today. The activity data behind the fleet figures.